Isaac Boger

Design Thinking

GIXSafeAndSound.png


What is design thinking…

Design thinking is a mindset and toolkit which uses scientific methods to find optimal solutions to design questions. It’s a balance of business, technology, and user experience, while always keeping people at the center of it’s focus.


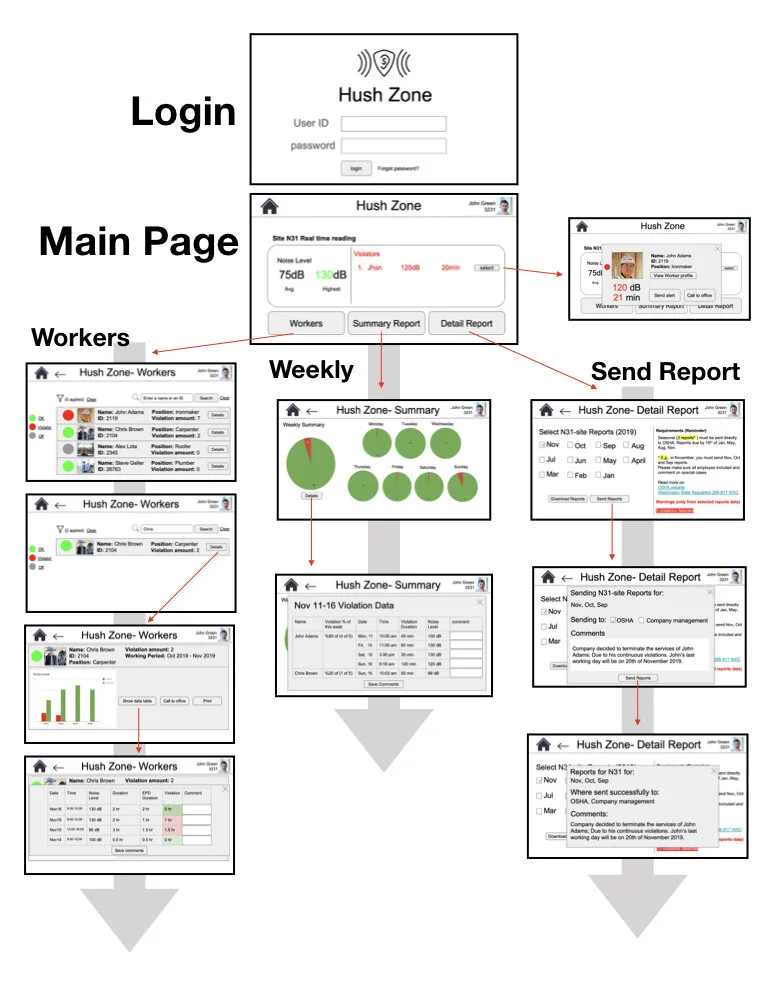
Below is a journal of a design thinking project I worked on as part of the Global Innovation Exchange masters program at the University of Washington.


Introduction


Despite strict regulation requiring the training and use of ear protection devices (EPDs) for construction works, a large percentage of them do not wear any EPDs at times they are exposed to dangerous levels of noise pollution. This is not just a problem for them (with a significantly higher rate of hearing loss than other populations) but also for the companies they work for and for insurance companies when lawsuits are raised.


Our Design Question:

 
How can we protect construction workers from hearing loss caused by the noise pollution from loud tools and heavy machinery at construction sites during their workday?
 

We choose this topic because while the noise pollution caused by construction is a major annoyance for everybody in their everyday lives (out building being right across the street from several large buildings going up), it’s a much more serious problem for the people who are next to the source of those sounds all day. We started wanting to solve the noise pollution problem for office workers and students and pivoted to the harmful effects on construction workers when we learned just how much this negatively effects them in a harmful permanent ways and how few real solutions are currently out there.

Why We Chose This Topic:

graphic.png
 

Our Team

Isaac-Boger_Square.jpg

Isaac Boger

Dual Degree

(MSTI + MSEDSIT), AUG 2021

Joey-Wang.jpg

Joey Wang

MSTI, Dec 2020

Amal_Abualrahi.jpg

AMal Abualrahi

MSTI, Dec 2020


Overview of Process

Over just 11 weeks, we went from nothing to a prototype for evaluation. Above is the road-map of the stages we went though on our journey.

Over just 11 weeks, we went from nothing to a prototype for evaluation. Above is the road-map of the stages we went though on our journey.


Before we can create the requirements for a solution, we need to explore the problem.

Investigation starts with secondary research to learn what information is currently available on the topic and to guide the next steps of field research and surveys so you are asking the right questions and know what to look for.


Secondary Research


ToolNoise.png

Construction tools cause dangerous levels of noise.

Approach

Secondary research was conducted on the internet with an emphasis on journals and academic publications.

 
dangerousDb.png

Dangerous levels of noise can cause permanent hearing damage quickly!

RESULTS

What we found supported our design question as a legitimate problem to be solved. The tools were creating dangerous levels of sound, and construction workers were being effected by hearing loss and damage more then the normal population by a significant amount. We learned that an alarming number of workers were not wearing hearing protection when they should, which turned our original idea of the problem on its head.

 
hpdChart.png

But workers are still not wearing hearing protection when they should…

Reflections

We had assumed that a device to better block noise or create less noise from tools was the solution, but the abundance of products to do both of these things (rarely being used) and the evidence of poor use of hearing protection suggested a deeper and more complex problem. Was this an issue with regulations or regulation enforcement? Was it an issue of a lack of education for workers on the subject? Was it an issue with the hearing protection current available? Cultural? We had a lot of questions, but luckily the next steps were to collect actual data to support or reject out hypothesis.

(One thing we hadn’t thought to look for at this stage (which I ended up finding later) was an OSHA document where they had comprehensively gone into the details of all of these questions. We checked the academic resources, but I should have read through the government ones too. Buried in the actual code was a document going into depth on the pros and cons of implementing various changes to the current laws and debate on those topics, which when I did manage to find became one of the most important pieces of research we had.)


Field Study


Construction Site in the Spring District, Bellevue, WA

Construction Site in the Spring District, Bellevue, WA

Approach

We conducted several observations to study the behaviors of construction workers. The observations were 30-60 minutes and done in several different times of workers’ shifts, including at the start of their workday, during their lunch break, and at the end of the day as they were leaving work. My two teammates observed a construction site for a building in Bellevue’s Spring District, and I chose to observe the construction site at Northgate’s upcoming public light rail station for an hour as a contrast to the private buildings in Bellevue.


RESULTS

After refining our notes, we pulled together our results with an affinity diagram (pictured right). Observations were extracted into key points which were grouped to form themes. These would later become invaluable for creating our set of design requirements. What we found supported our secondary research and gave some more context. We saw workers largely not wearing hearing protection even when operating the loudest tools (chop saws). We saw one common situation as the worker forgetting to put them on at the beginning and then sometimes thinking about it and putting them into after a while or taking them out before the sound had stopped

Affinity Diagram - Field Study

Affinity Diagram - Field Study


Observation of actual users proves to be extremely valuable.

Observation of actual users proves to be extremely valuable.

Lessons

While we expected the user pool or construction workers to be a little bit hard to observe and possibly not giving that much useful information, this actually because our most valuable tool when the survey didn’t yield as much objective data as we had hoped (more later).


Survey


Paper surveys were handed out in person outside a construction site in the upcoming Spring District, in Bellevue, WA

Paper surveys were handed out in person outside a construction site in the upcoming Spring District, in Bellevue, WA

Approach

From our secondary research and field observations, we decided on some questions we still needed answers to that were too hard to observe in the field such as personal reasons for actions and worker perceptions. Our first step was to create a paper survey form (pictured right).


RESULTS

After significantly lackluster responses in person, I decided to make an online form to have greater reach. While this did finally give us enough results to work with, it did make it a little harder to control for as many factors as is possible when you can see the site yourself. I knew that the workers were already feeling a bit uneasy about being questioned, so I made sure to directly reference the school in the form and on the letterhead to help with their fears.

Link To Digital Survey: GIX Research Survey

Digital surveys were “handed out” both in person at the construction site in Bellevue, and online through social media on pages for Seattle construction workers.

Digital surveys were “handed out” both in person at the construction site in Bellevue, and online through social media on pages for Seattle construction workers.


SurveyResults.png

Results from both the paper surveys and the digital ones were analyzed in an excel spreadsheet and visualized through builtin online tools connected to the digital survey.

Lessons

We expected the survey to yield the most data, but we ran into a problem we hadn’t thought of ahead of time. The workers answered differently in person as online, mainly the ones in person tended to rate their employers as more strict and themselves as following the rules more). We suspect from this fact, as well as from comments made from the workers who were given surveys in person being worried about privacy, that getting fired for telling the truth was a very real worry for them. Had we guessed that this topic would be tense, we would have made sure that more of our tests were done online, though the difference was instructive in its own way too.


SurveyResults.png

Survey Results

Expanded View - Digital and Paper

Ideation

 
The storyboard I made explores “core tasks” of the construction worker as a user, and explores how the devices would actually be implemented to solve the design requirements.

The storyboard I made explores “core tasks” of the construction worker as a user, and explores how the devices would actually be implemented to solve the design requirements.

A Storyboard I made to explore one possible solution.

Armed with a triangulated set of data from our secondary research, field study, and survey, we used the common themes to brainstorm possible solutions and explored those ideas through storyboards and sketches. I honestly didn’t think there would be much use in this stage, but drawing out an interaction went a huge way to dialing in what would and wouldn’t be practical in a solution and really helped me picture the soltuion as we moved into the later stages of our exploration.

ProductDrawing.jpg

Physical Product for Workers

My Design: Individual noise sensing and signalling helmet mounted device with a highly visible external indicator to show if its in use.

TechDrawings.jpg

Apps for Workers, Supervisors, and Database Software for OSHA

My Design:

• Worker’s app gives daily feedback and advice.

• Supervisor’s app provides worker compliance tracking and reporting.

• OSHA software allows easy monitoring and regulating.


Prototype


flowchart1.jpeg

Product flow chart

A medium fidelity UX Design for a worker noise level tracking and reporting app

Approach

Having explored various solutions, we determined that the reason that there were not yet any real solutions to this problem was that the problem had many causes that needed to be tackled simultaneously to make areal difference.

  1. Workers needed to have a way to know instantly when they were being exposed to dangerous levels of noise without making judgement calls.

  2. Hearing protection use had to be easy to supervise and consistent in it’s enforcement. We would need an app for supervisors to track employees local noise levels and hearing protection device compliance.

  3. OSHA needed to have a way to enforce its rules on hearing protection (and needed expanded rules). Accountability couldn’t just come when OSHA could stage a surprise inspection. The responsibility should be on the companies and not the government to offer reports.

Because running tests on OSHA employees would be impossible and on construction workers impractical given our time-frame, we decided to focus on the app for supervisors. With only a week for design before we would need to test, we had to pick one of the three, and an app would be more practical to build in the short time-frame.

 
Prototype Supervisor App

Prototype Supervisor App

Process

It’s important to get early feedback in the design process to avoid later redesigns that can be extremely costly in both time and money to fix. Once a digital product is coded or a physical product is actually developed, vital misconceptions about how the user will use and experience your product can mean very difficult to changes and can lead to those important insights being ignored to meet deadlines and budgets and an inferior product. Using only Microsoft PowerPoint and linked slides, we were able to make a convincing simulation of the entire UX of our product for supervisors, allowing us to make drastic changes like the addition and removal of major features with minimal cost and were able to create this (simulation) of a very complex piece of software in less than a week.

 
powerpoint.png

Medium-Fidelity Prototype

Rendered in PowerPoint, with links for interactivity.

RESULT and lessons:

LINK TO PROTOTYPE (UW Accounts Only)

It was incredible to see just how realistic a digital product could be made with such simple tools. What would have taken significantly longer to even program the basic UX using traditional software took hours and by all accounts, the only way you could tell it wasn’t a real application was the inability to type out what you wanted in fields.

By anticipating what users would click on in response to our set of tasks, we were able to make even interactions unrelated to the task have the correct behavior with only 29 slides. With a limited smaller round of evaluation before the full scale evaluation to iron out the bugs in our test plan and refine the prototype, I am pretty confident that we could have accounted for every interaction and made a functionally accurate recreation that didn’t limit users at all in how they used it.

Evaluation


Approach

Due to restrictions on the availability of construction supervisors, we conducted the study using students who were given background information and asked to pretend as if they were supervisors. If a product can be intuitive to students it will be especially intuitive to those with prior experience with the construction terminology and tasks.

Using a formal approach to product evaluation, we invited three participants to test out our prototype app in recorded moderator lead seasons. As the moderator for all three sessions, I studied techniques to encourage participants to share useful insights without leading them or projecting personal beliefs onto their responses.

RESULTS and lessons

While we found many specific things to improve our app’s experience from our testing, more interesting are the themes we found from the results.

Because we knew the problem space, we knew what it was supposed to do, things which we thought were intuitive turned out not to be upon testing. Simple things like buttons that we felt implied interactivity, labels we assumed were clear, or even the entire logical grouping of the pages of the app were shows to have a lot of room for improvement.

And it wasn’t just taking their word for it: hearing the comments and seeing the sticking points, one could really see in retrospect what was wrong that was a blind spot during the creation.

Also surprising: Even a small number of participants (3) showed clear themes and an experience that was more common than different.

 
FilterButtonUnclear.png

Example Finding:

Filter symbol is not obviously an interactive UI element. Placing the symbol in a button would alleviate users problems figuring out how to filter the search results.


Just one of the many finding we found from our evaluation that was not expected at all. It’s easy to be “too close” to the problem and miss how fresh eyes would see the situation.

Moving Forward

 
Source: Presentation Slides, Sarah Zuberec, 2019

Source: Presentation Slides, Sarah Zuberec, 2019

Thoughts

Our project stopped at the evaluation stage because of the courses design, but in the real world this would have just been the middle of the process with more iterations and the rest of the solution being explored. Even with such a limited set of features tested from this very limited time frame exploration, it was easy to see how the same tools and methods could be used to prototype and evaluate the other parts of the design, and to iteratively refine the prototypes using the same techniques into a production quality solution.

HardHat.jpg
database-blue.png

Lessons Learned

What you think is the problem may not be the problem.

While it may seem frustratingly slow at first, properly defining the problem is arguably the most important step. It’s far too easy to waste time and energy pursuing a solution to a problem that doesn't exist.


What you think is a solution may not be the solution.

One of the hardest, but also more valuable parts for the scientific methods of design thinking is separating what you think a solution to a problem should be from what the qualitative and quantitative data you collect shows a solution is actually. Related to this is the difficulty and value is exercising restraint in cherry picking results that support your presumptions rather than exploring the area from an unbiased position.


Design thinking uses the scientific method to help us stay objective in the often unscientific field of design.

We started out thinking that the problem leading to construction worker hearing loss was just a failure of the workers to use hearing protection when they need to, but through our study we learned that is only one of the many causes. If we had not explored the problem with quantitative and qualitative research, we would have missed this vital insight.

Reflection

Mindset

More then anything, the thing that this ten week exploration taught me was a different approach to solving problems. As somebody with a primarily scientific and engineering background, my first instinct is always to start with the solution and then work back to figure out if it can fit the problem. Design thinking flips this on its head. It stresses the importance of starting with a well defined and explored problem before any potential solutions are made. Solutions must fit design requirements and design requirements must fit the user.

I can see how important this mindset can be to cultivate when tackling difficult problems, as we did in this experiment. No matter how brilliant your technology is, if it doesn’t fit the user’s needs, it doesn’t solve the problem. The user centered mindset that design thinking will certainly be a valuable thing as I move on in my career. I’m sure I will still jump to solutions as a first instinct, but I will now also remember to think of the problems too.


Experience

Its one thing to learn about problem solving tools and another to actually go out and use them. This project wasn’t without it’s failures. I started so focused on the solution I had in mind, a physical product for construction workers, that by the time we had really found out the problem was deeply rooted in the companies and regulations we had already missed valuable opportunities for exploring those areas more thoroughly due to time considerations. And I believe this was largely my fault. Another member of the team kept trying to push us in the direction of regulations as a solution and myself and the other member kept resisting it at every turn, even leading to a few heated conversations. It was humbling to be wrong in a group and a learning experience to realize that my conviction railroaded the project away from the optimal path.

What has been so valuable to me personally from this was the opportunity to have this kind of failure in a safe setting and learn from it. Yes, our solution could have been more robust had I been a better team member from the start and really listened to opposing views, but I can carry this experience into future projects and when somebody offers a very different viewpoint from my own, even when I’m so sure I know what I’m talking about, I can think back to a time that I was so sure and was wrong and really give my teammates the benefit of the doubt.


Through this exploration I was able to learn and refine a wide variety of invaluable skills that have certainly made me a more capable designer, but also a more capable thinker:

  • Teamwork and Collaborative Design

  • Formal Design Question Formulation

  • Using Affinity Diagrams to Extract Actionable Trends in Qualitative Data

  • Field Study Methodology and Best Practices for Collecting Qualitative Data

  • Survey Methodology and Best Practices for Collecting Quantitative Data

  • Creating Prioritized Design Requirements from Triangulated User Research

  • Using Scenarios, Sketches, and Storyboards for Exploring Potential Solutions

  • Running Scientific Evaluations with a Formal Protocol for Product Feedback

  • Writing and Presenting Reports on Design Process and Product Design

  • Web Development

Much beyond the limits of this one exploration, I have already found myself using tools and skills such as affinity diagrams and the formal declaration of design questions in other projects and expect to use these tools to great effect thoroughly in both the remainder of my masters program at at future jobs.

Tools and Skills

Special Thanks:

 
Sarah-Zuberec.jpeg

Sarah Zuberec

Instructor

ArpitaBhattacharya.jpg

Arpita Bhattacharya

Teaching Assistant

AlisonBuchanan.jpg

Alison Buchanan

Teaching Assistant